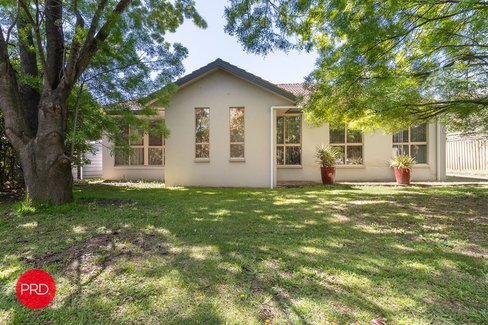
3 /
32
Macquoid
Street
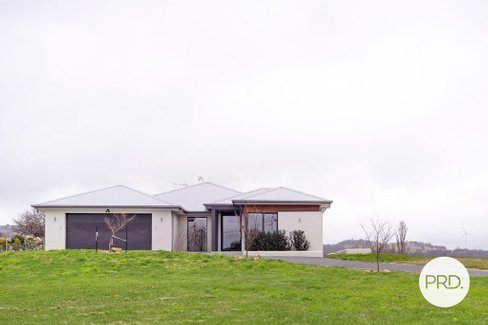
QUEANBEYAN EAST, NSW
Under Offer
 3
3
 2
2
 1
1
UNDER OFFER